Draw Shapes,Text,Polygons,Blend,Blur images | Using OpenCV With Python | Easy code
In this Article (Click to skip to that topic):
Pre Requesites: Jupyter or any python editor
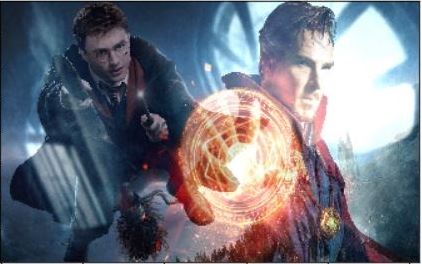
Blend: How to Combine 2 Images?
Blending in OpenCV is joining two images of same size into each other.
We can make cool posters, blend your loved ones picture with their favourite character on background and gift them, bring out your creativity and what not!
Lets begin the magic!
import cv2 #opencv library
import matplotlib.pyplot as plt # Matplotlib used for visualization
%matplotlib inline
# Reading the jpeg formmatted image from its path to img1
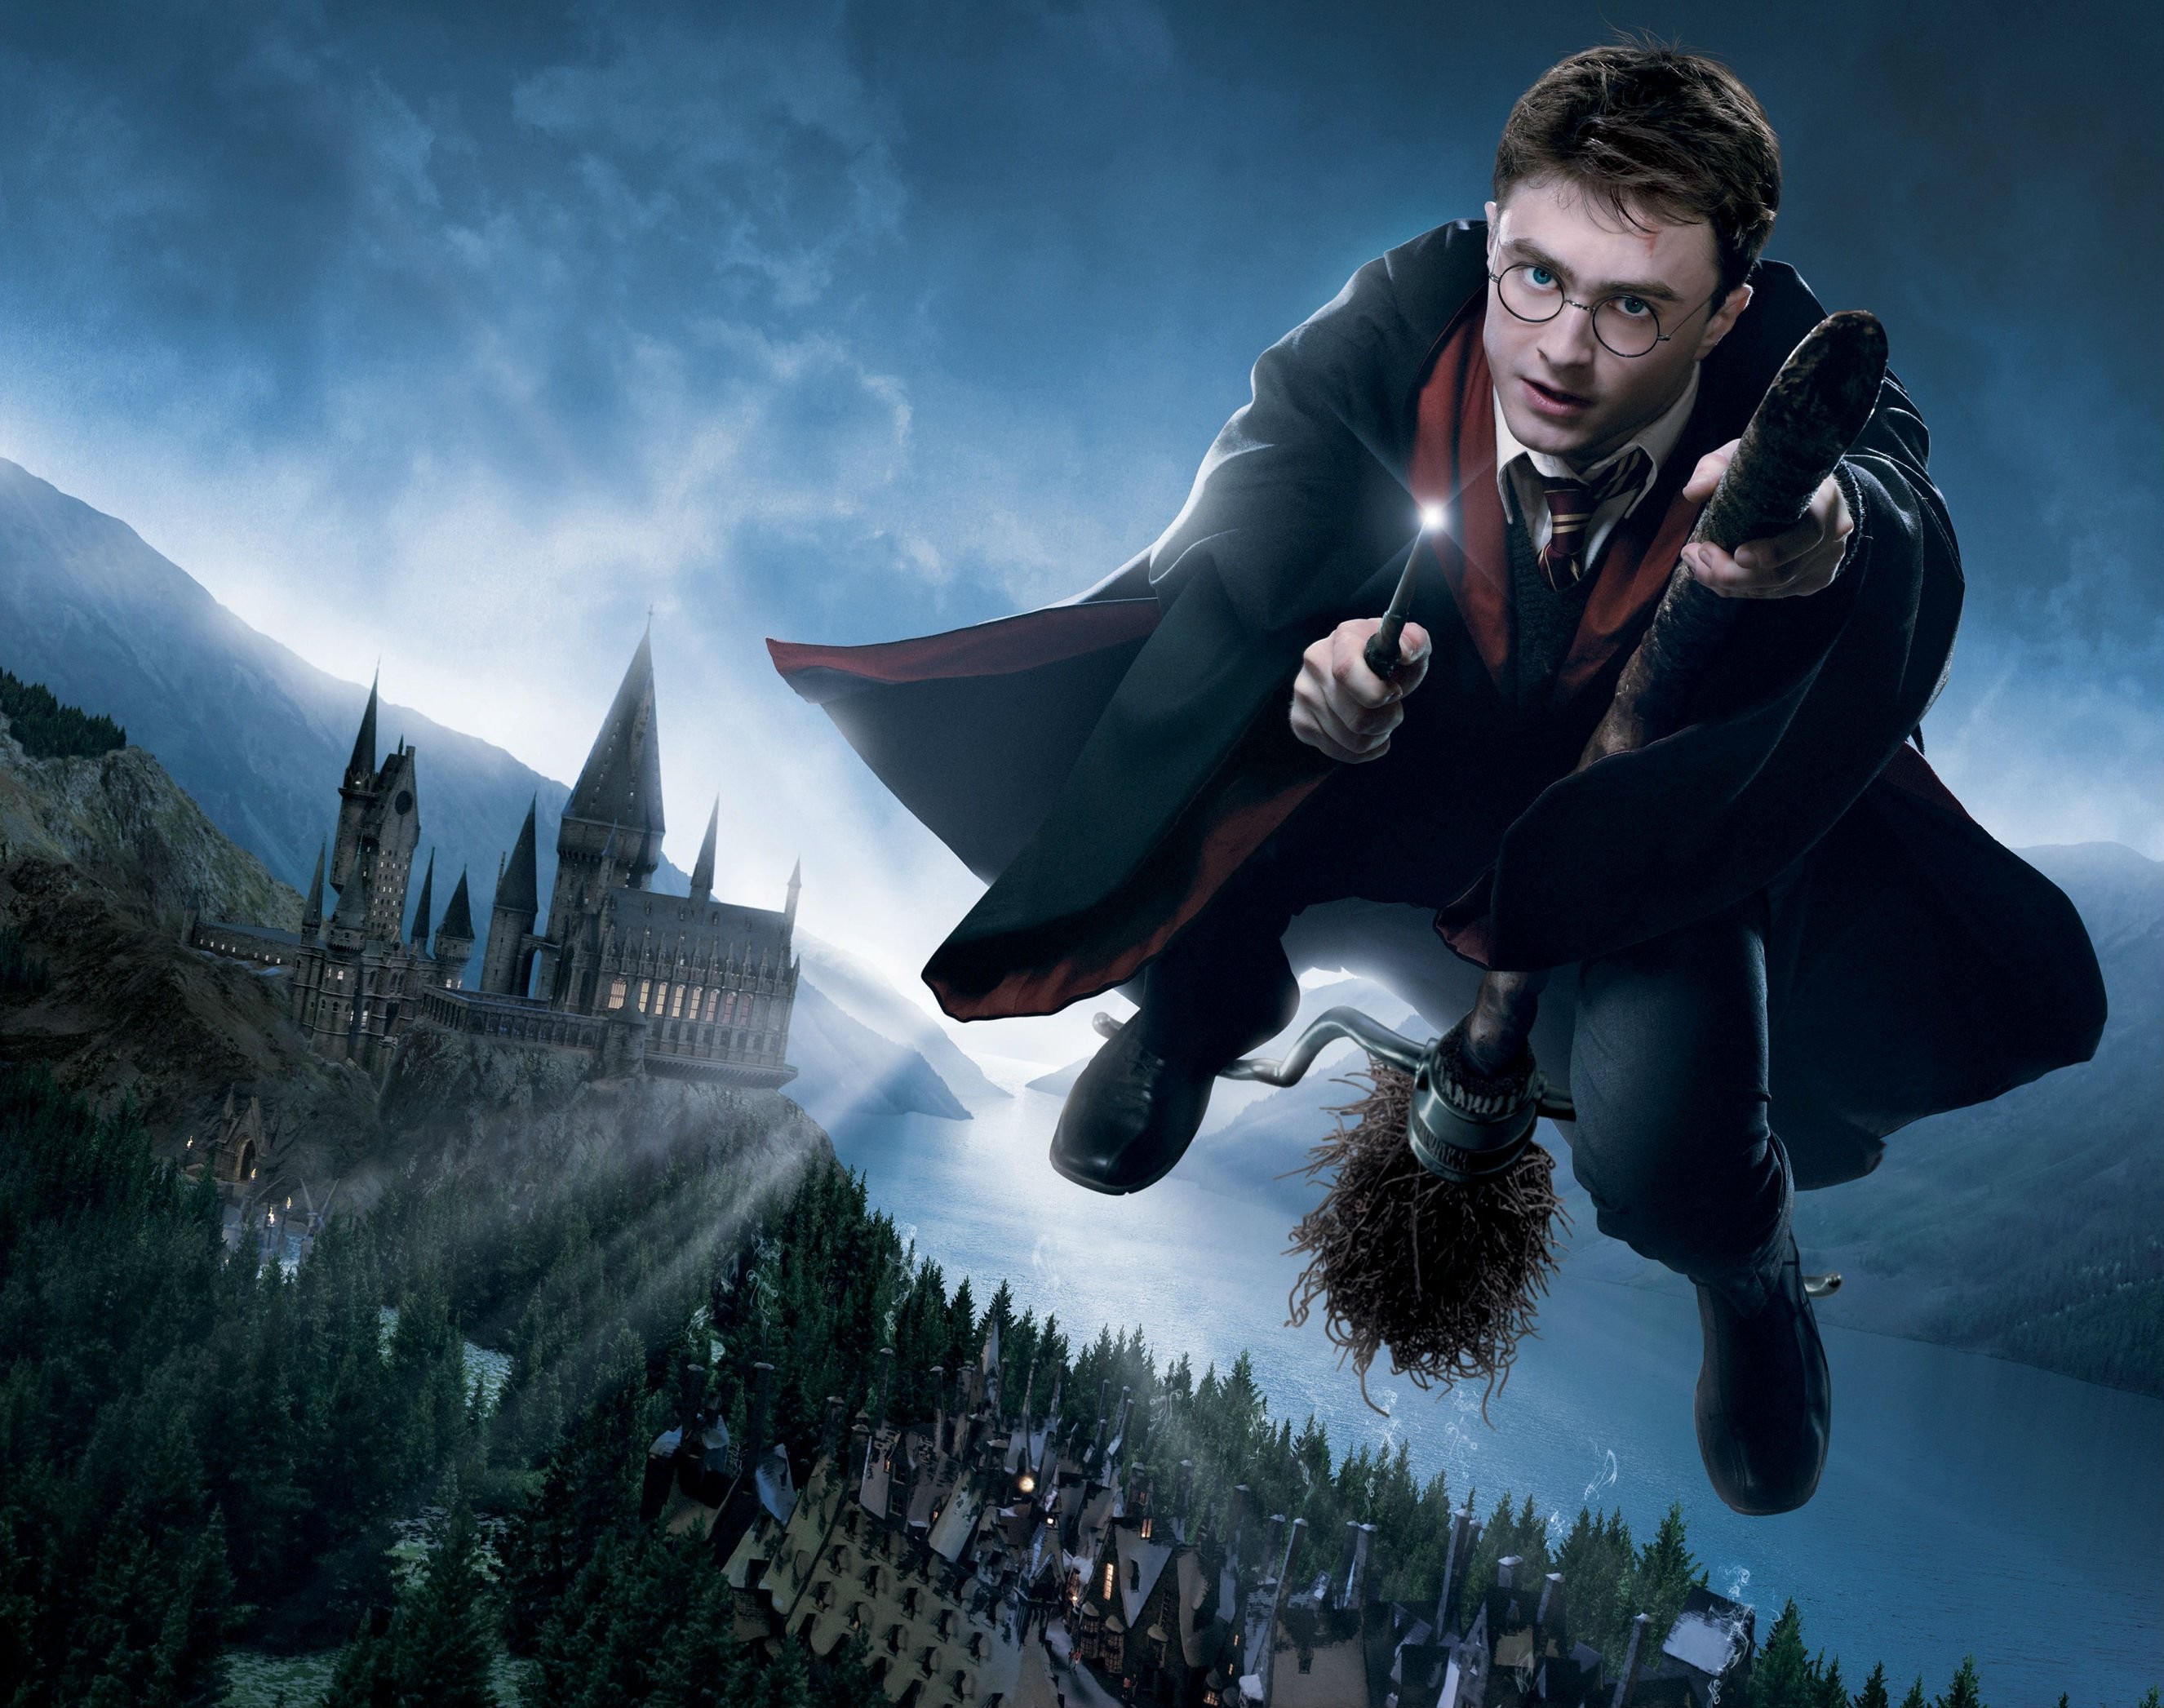
img1=cv2.imread(r'./img/hp.JPG')
# Reading the jpeg formatted image from its path to img2
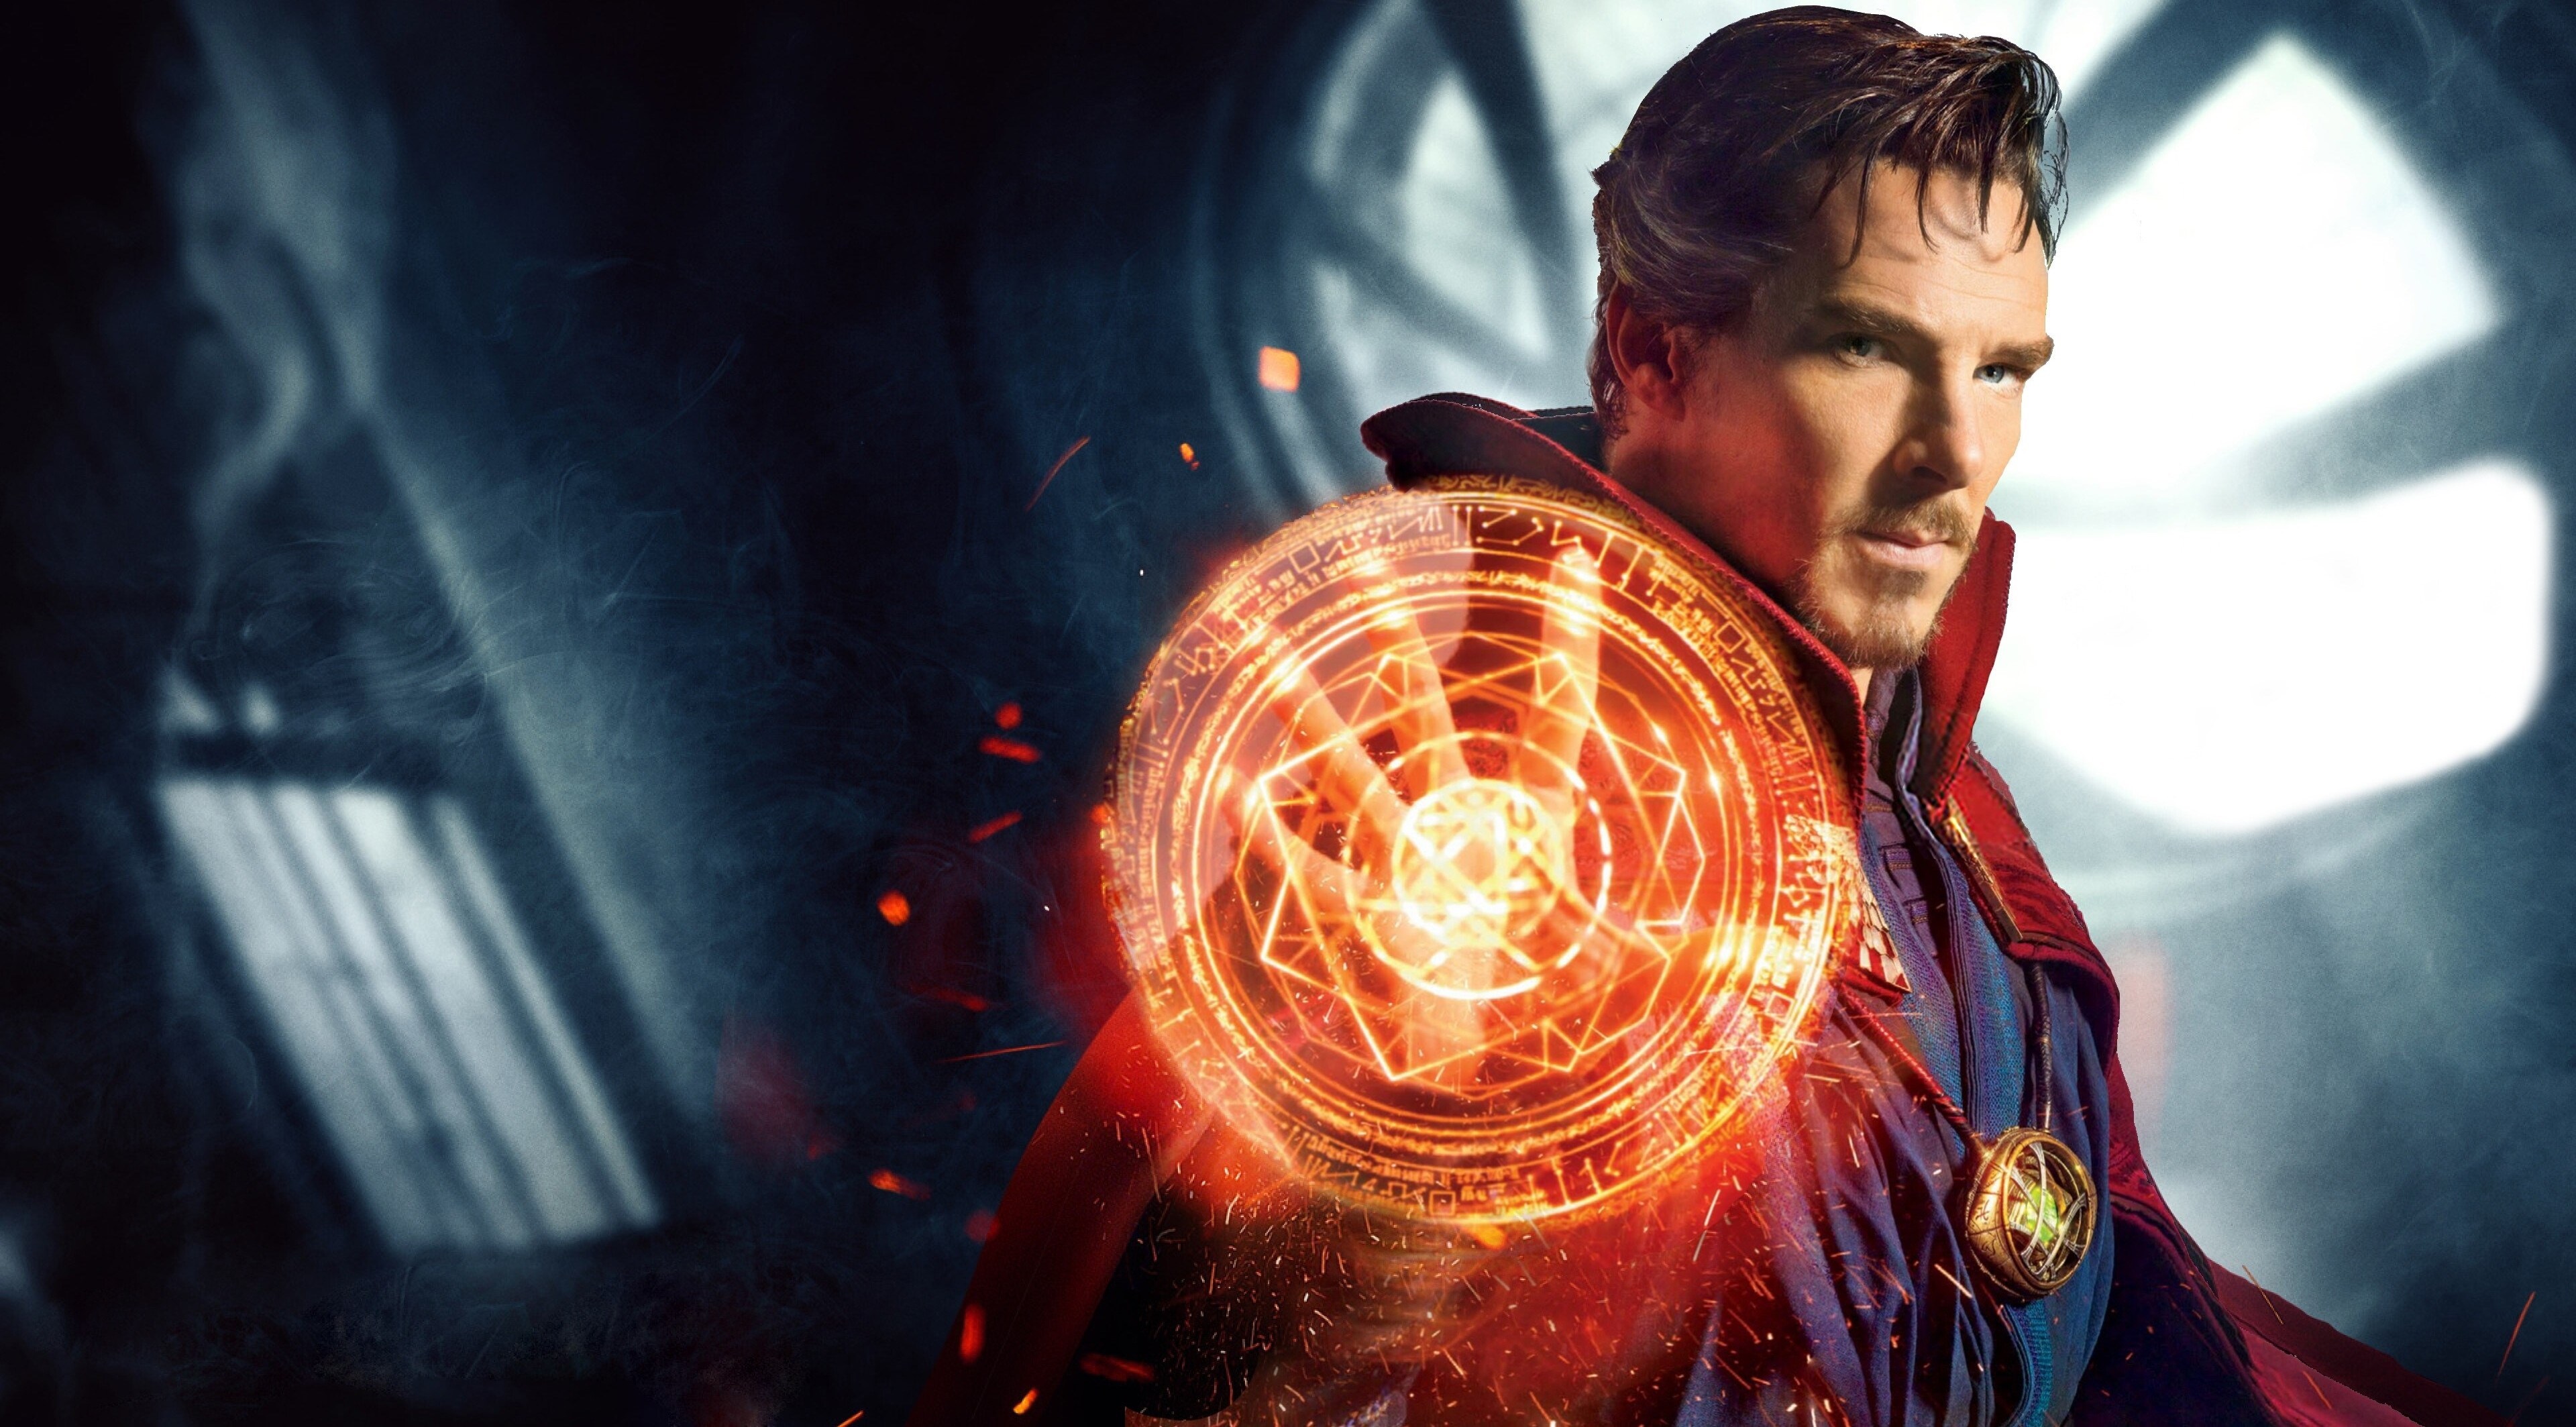
img2=cv2.imread(r'./img/doc.JPG')
# Converting from BGR(blue,green,red) color space to RGB using cvtColor
img1=cv2.cvtColor(img1,cv2.COLOR_BGR2RGB)
img2=cv2.cvtColor(img2,cv2.COLOR_BGR2RGB)
# Displaying the image 1
plt.imshow(img1)
# Displaying the image 2
plt.imshow(img2)Output:
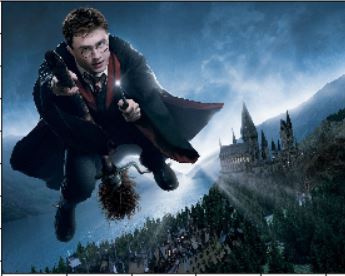
    #'1' Flips image to left side, '0' to upside down and '-1' to combination of both 0 and 1
    flip_img=cv2.flip(img1,1)

    # Showing flipped image
plt.imshow(flip_img)Output:
    # Gives the shape (height,width, no.of color channels(RGB)) of image1
    flip_img.shape
Output:
(2093, 2652, 3) # Gives the shape (height,width, no.of color channels(RGB)) of image2
img2.shapeOutput:
(2127, 3840, 3) # Both images should be of same size to blend.
flip_img=cv2.resize(flip_img,(2652,2093))
img2=cv2.resize(img2,(2652,2093)) # Increase in alpha increases img1 weightage,beta for img2
blended=cv2.addWeighted(src1=flip_img,alpha=0.9,src2=img2,beta=0.9,gamma=0)Output:
    # Saves the blended img under the name blended.JPG
    cv2.imwrite('blended_img.png',blended)
Output:
TrueDraw Shapes on Image
Different shapes can be drawn on an image, to mark an object or create a figure etc.
- Rectangles
- Hollow circles
- Solid Circles
- Lines
and many more can be drawn using OpenCV.
    import cv2 #  opencv library
    import numpy as np
    # Matplotlib used for visualization purpose
    import matplotlib.pyplot as plt
    %matplotlib inline

    # Array of size 512x512 filled with zero as values,
    # to create an image with black color.
    img=np.zeros(shape=(512,512,3),dtype=np.int16)

    # Displays the shape(Height,width,no.of color channels(RGB))
    img.shape
Output:
(512, 512, 3) # To display the image
plt.imshow(img)
    # cv2.rectangle(image, start_point, end_point, color, thickness)
    cv2.rectangle(img,pt1=(0,0),pt2=(100,100),color=(0,0,255),thickness=10)
Output:
array([[[ 0, 0, 255],
[ 0, 0, 255],
[ 0, 0, 255],
...,
[ 0, 0, 0],
[ 0, 0, 0],
[ 0, 0, 0]],.. plt.imshow(img)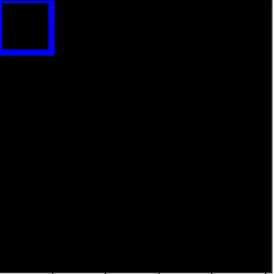
    # cv2.circle(image, center_coordinates, radius, color, thickness)
    cv2.circle(img,center=(150,150),radius=100,color=(255,0,0),thickness=10)
Output:
array([[[ 0, 0, 255],
[ 0, 0, 255],
[ 0, 0, 255],
...,
[ 0, 0, 0],
[ 0, 0, 0],
[ 0, 0, 0]],
[[ 0, 0, 255],
[ 0, 0, 255],
[ 0, 0, 255],
..., plt.imshow(img)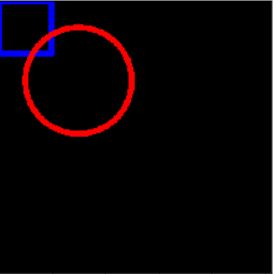
    # Negative values for thickness results in filled/solid circles
cv2.circle(img,center=(200,200),radius=100,color=(255,255,0),thickness=-10)Output:
array([[[ 0, 0, 255],
[ 0, 0, 255],
[ 0, 0, 255],
...,
[ 0, 0, 0],
[ 0, 0, 0],
[ 0, 0, 0]],plt.imshow(img)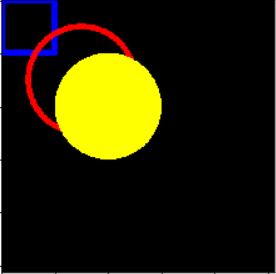
    # cv2.line(image, start_point, end_point, color, thickness)
cv2.line(img,pt1=(275,275),pt2=(512,512),color=(0,255,0),thickness=10)Output:
array([[[ 0, 0, 255],
[ 0, 0, 255],
[ 0, 0, 255],
...,
[ 0, 0, 0],
[ 0, 0, 0],
[ 0, 0, 0]], plt.imshow(img)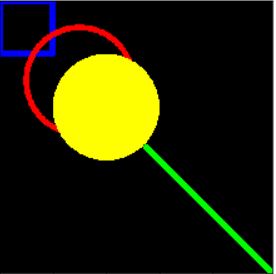
    # Font of the text
    text_style=cv2.FONT_ITALIC

    # Syntax
    #cv2.putText(image, text, org, font, fontScale, color[, thickness[, lineType[, bottomLeftOrigin]]])

    cv2.putText(img,text='HAKUNA MATATA',org=(10,200),fontFace=text_style,fontScale=2,color=(0,0,255),thickness=3,lineType=cv2.LINE_AA)
Output
array([[[0, 0, 0],
[0, 0, 0],
[0, 0, 0],
...,
[0, 0, 0],
[0, 0, 0],
[0, 0, 0]],.. plt.imshow(img)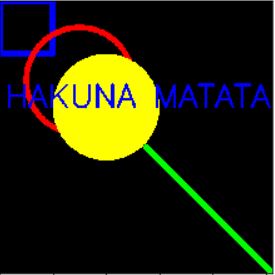
Draw a Polygon
    import cv2
    import numpy as np

    # Matplotlib used for visualization purpose
    import matplotlib.pyplot as plt
    %matplotlib inline

    # Array of size 512x512 filled with zero as values,
    # to create an image with black color.
    img=np.zeros(shape=(512,512,3),dtype=np.int16)

    # Assigning vertices to polygon
    poly=np.array([[100,200],[200,100],[400,300],[200,400]],dtype=np.int32)
poly.shapeOutput:
(4, 2) # Reshaping according to opencv format
poly_new=poly.reshape((-1,1,2))
poly_new.shapeOutput:
(4, 1, 2) # cv2.polylines(img, pts, isClosed, color[, thickness[, lineType[, shift]]])
cv2.polylines(img,[poly_new],isClosed=True,color=(0,255,0),thickness=10)Output:
array([[[0, 0, 0],
[0, 0, 0],
[0, 0, 0],
..., plt.imshow(img)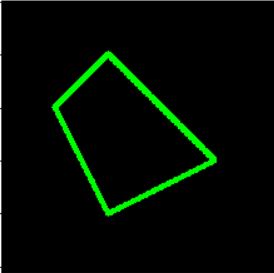
Blur an image
There are plenty of blurring techniques available.Some of the methods are:
- Default Blurring Technique
- Gaussian Blurring Technique
- Smoothing Technique
- Median Blurring Technique
- Bilateral Filter Blurring Technique
Lets explore each one of them:
     import cv2  # opencv library

    # Matplotlib used for visualization
    import matplotlib.pyplot as plt
    %matplotlib inline
    import numpy as np

    img=cv2.imread(r'./img/image.JPG')
    img=cv2.cvtColor(img,cv2.COLOR_BGR2RGB)
    plt.imshow(img)
    kernel=np.ones((5,5),np.float)/25

    # Default Blurring Technique
    plt.imshow(cv2.blur(img,ksize=(5,5)))
    # Gaussian Blurring Technique
    plt.imshow(cv2.GaussianBlur(img,(5,5),0))
    # Smoothing Technique
    plt.imshow(cv2.filter2D(img,-1,kernel))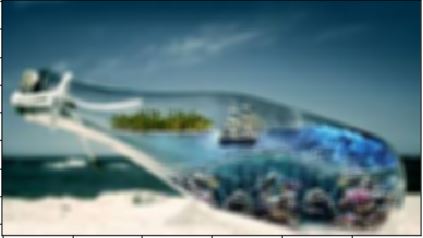
    # Median Blurring Technique
    # Reduces unwanted noise
    plt.imshow(cv2.medianBlur(img,5))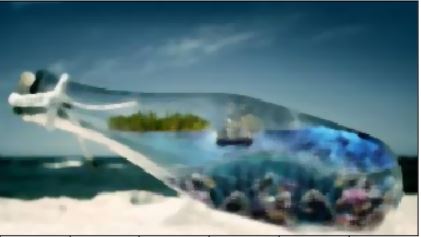
    # Bilateral Filter Blurring Technique
    # Reduces unwanted noise with sharp edges but slow
    plt.imshow(cv2.bilateralFilter(img,9,75,75))
Try out all these and feel free to ask me doubts via gmail at: jayachandrika56@gmail.com
Now you can follow us to explore more interesting topics, in Instagram at: @code_voyager
Hope you had fun experimenting with the code. Have an amazing day!